
Do you know what’s driving spikes in your website traffic? Or increases in website sales or donations?
You probably get the same questions other marketers do from colleagues or executives:
“Did that PR launch drive website visits?”
“Did we see an uptick in traffic and revenue after that TV program aired?”
A website dashboard can help you identify what might be driving measurable changes in your key website statistics. Here’s how to create one.
Step One: Identify Popular Inbound Links
Hopefully you are already tagging urls from your blog, social media sites, web banners/badges, email campaigns, and other inbound links with campaign tracking codes, through Omniture, Google Analytics, or another analytics platform so you can track clicks from your own channels. If so, you will want to make a list of the ones that drove significant traffic. But even after you look at those numbers, you probably still have a large segment of website visitors that are unaccounted for – whether from search engines or direct or bookmarked visits. So the question is, what is driving those visits.
Step Two: Aggregate Cross-Departmental Calendars of Events
If your organization keeps a master calendar of major events and activities, congratulations. If yours is like most organizations, these calendars are housed in departmental silos, and some departments may not keep a calendar (I know, hard to believe). Compiling calendars will be easier than convincing departments that they need to start keeping one. But both are worthwhile efforts if you truly want a clearer picture of the external influences on your website.
Step Three: Isolate the Important Events
Look through the aggregated calendar and highlight the items that have the most potential to trigger a response – whether general interest or a direct action – from the audience or recipients. Yes, be sure to identify those items that reach a wide constituency, but also those that are particularly targeted toward your strongest supporters, customers, and prospects. Product launches, national events, earnings reports, email solicitations, major media relations efforts and placements, direct mailings, corporate sponsor promotions, and ad campaigns are the types of things you will want to compile.
Step Four: Chart Website Traffic, Sales or Donations, and Revenues Along with Events
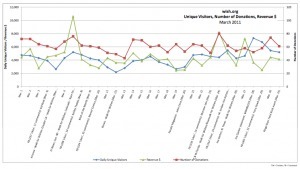
Once you have all of the raw data, you can create a spreadsheet graphic that tracks website visitor trends, the number of people who completed a sale, or a donation or nonprofits, and the total daily revenues from those transactions. Then plot your major events in conjunction with the charted metrics over a designated time period – we compiled it monthly. Here is an example of one of our website dashboards:
We also looked at separate website dashboards for weekdays and weekends, as we saw different trends Monday-Friday vs Saturday and Sunday.
Step Five: Analyze the Dashboard for Insights
You probably will immediately see some obvious signs of causal relationships between particular events and your key metrics – whether some outreach efforts or events drive traffic, but not sales or donations, and vice versa. But, like us, you probably also will see some spikes where you don’t have any major events listed, or some peaks and valleys where you might not have expected them. So the dashboard represents a good tool for identifying where more information is needed, where you might need to dig deeper to confirm whether particular events truly were responsible for heightened activity, and what questions to ask in order to get these answers.
Step Six: Repurpose the Dashboards
Once you have your website dashboard in place, don’t limit yourself to general weekly or monthly tracking. Think about applying it over the course of particular campaign timelines to compare against traffic, sales/donations, and revenues from past years during the same period, and against your goals for those campaigns.
Using benchmarks and targets, tracking real-time progress, and having a sense of what is driving what will provide you with the hindsight and vision to know what needs to be done to fulfill your goals.
Is this helpful to you? Do you do something similar? Or do you take a different approach that you think works better?